After finding the right sensor and the right connectivity, the data is delivered to our service platform. You get an accurate, real-time visualization of your collected data. Our data visualization platform is a decision-making tool. In this way, you can optimize the functioning of your organization and the comfort of your users.
Manage objects
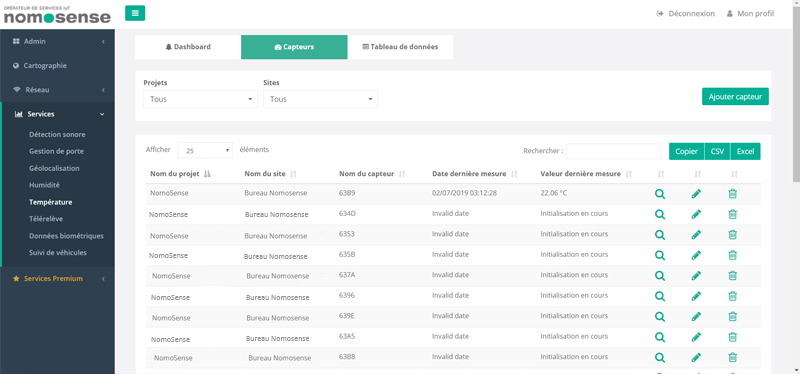
Find on our hypervisor all the information you need to manage your connected devices:
Manage the life cycle of your sensors and track the value of your latest measurements in real time.
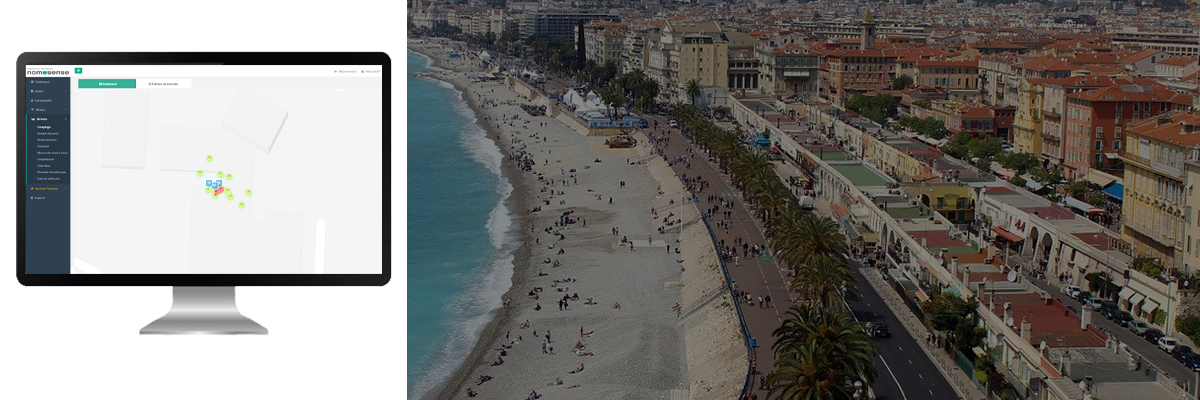
Continuously monitor the position of your sensors to improve their management.
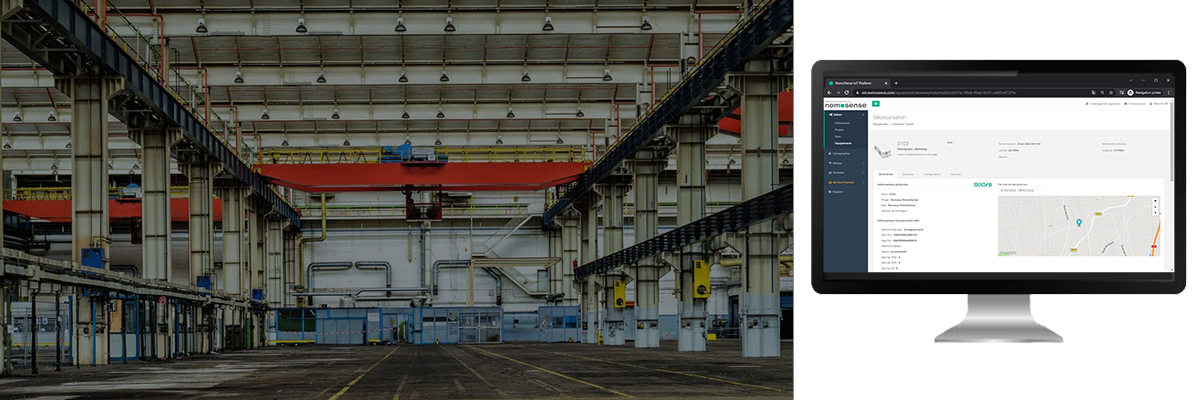
Access the details of your equipment to monitor its status, set up alerts, change location etc.
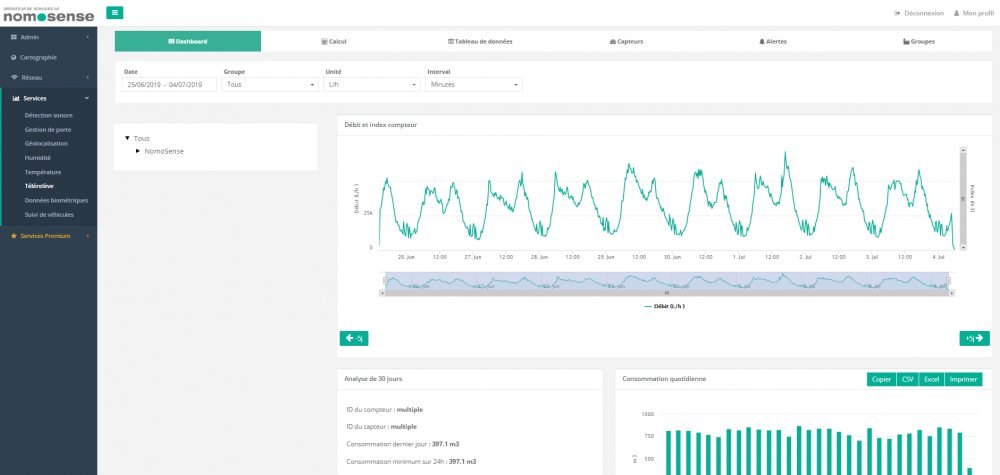
Analyze and export the data
Analyze your data with the different predefined or customizable dashboards according to your needs. Export data in various forms (excel, print…) to share them with all your teams and help them make the right decisions on your collected data.
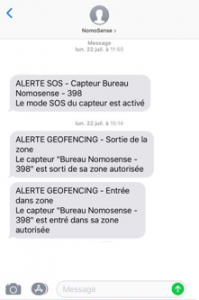
Be alert and act effectively
You will receive an alert by email configured upstream via the hypervisor. These alerts can concern the export of reports (daily, weekly, etc.), the operating status of equipment (sensor failure, etc.) or the monitoring of measurements (threshold exceeded, zone exit, etc.). With the appropriate service level, you can also receive alerts by SMS or Whatsapp message, which will allow you to act accordingly. This type of alert can also be adapted to all our other services at your request. This way you can act efficiently and make the best decisions for your organization