Skip to content

Slide
Browse on the equipment interface

To visualize all information of an equipment, it is necessary to understand how the interface of an equipment works. To access this interface, go to Admin category then in Equipment, type the name of the equipment in the search bar and click on the magnifying glass to open the details. 

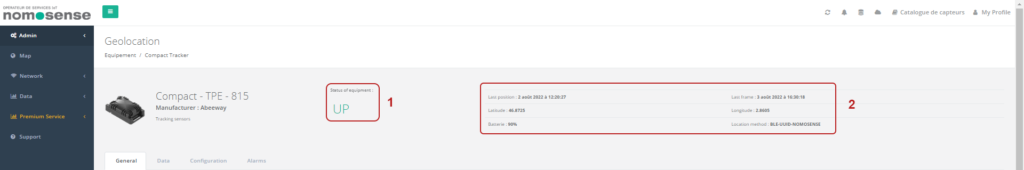
This interface are divided into 4 sub-tabs with a general banner presenting the sensor : 

  1. View the status of the equipment (Up / Down)
  2. Find the last measurements returned by the sensor, in real time 

General

In this tab, you can :

3.Visualize general sensor information
4. B
e informed to the sensor’s battery level
5. Choose a measurement period and view the sensor location in time 
6. Run and stop the script
7. Refresh the data 
8. Edit the sensor
9. Delete the sensor : a new window opens to confirm or not the deletion of the sensor.

Data

The data tab includes the list of data returned by the sensor, you can :

    3. View all raw data returned
    4. Choose a period to view the data : 

    a. Choose the date according to the proposals
    b. Choose in a personalized way 
    c. Apply the choice

    5. Export data in various formats

    Configuration 

    This tab is only available for people with Admin roles on the hypervisor. It is specific for each sensor because they can have several configuration modes.

    Alarms 

    This tab allows you to receive emails from an event. The alarm activation is also specific for each sensor. On the other hand, the visual of the page is general and you can : 

    1. Check the boxes of the alerts you wish to subscribe to  
    2. Unsubscribe by unchecking the box 
    3. Find the history of all alarms received 
    4. Received an alert notification
    alarme alerte